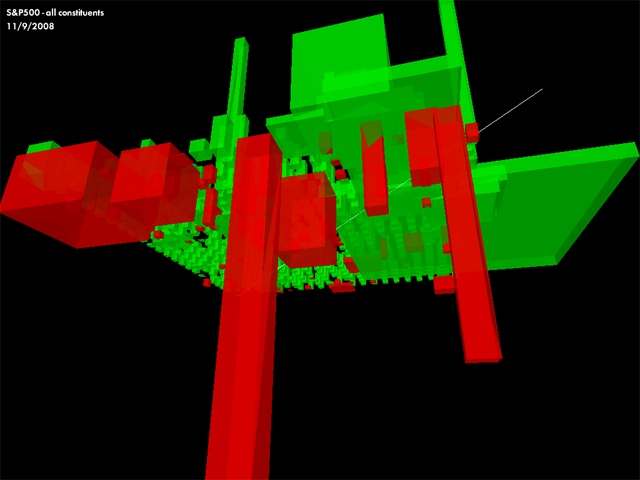
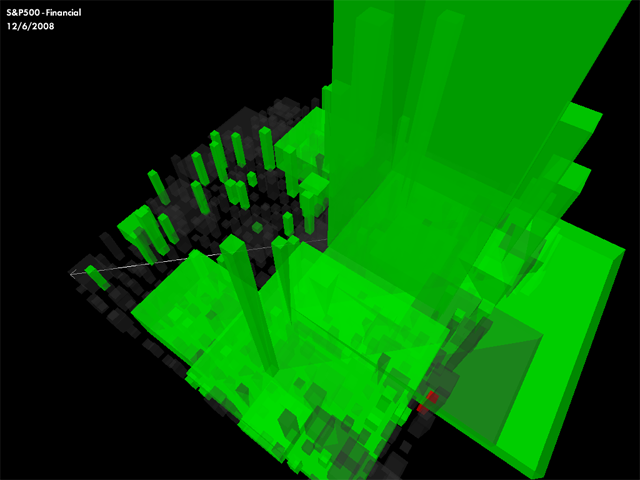
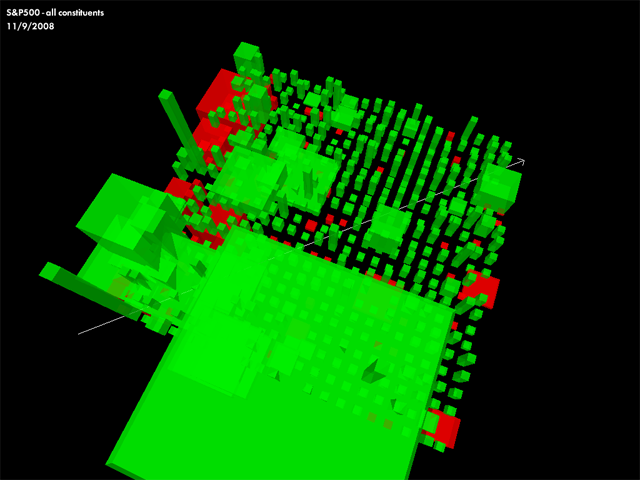
Marketscape is an experimental data visualization of the S&P500 index, representing daily market activity as a virtual data artifact. It depicts index constituents as individual volumes, reflecting price change through height of extrusion and color, as well as trade volume through size. Following a one-dimensional tabular format, constituents are arranged based on price—the trajectory from minimum to maximum price indicated by a white vector. Clicking on a constituent isolates it along with other constituents related by industry.
 www.christianmarcschmidt.com
'live! > art & news' 카테고리의 다른 글
| 수퍼하이웨이 첫 휴개소 (0) | 2009.03.10 |
|---|---|
| Paraflows 09_Festival for Digital Arts and Cultures (0) | 2009.03.04 |
| 디지털 음원 서비스의 새 패러다임 (0) | 2009.03.04 |
| SICAF2009 국제 디지털만화 공모전 뉴스레터 No.2 (0) | 2009.03.04 |
| 세빗(CeBIT) 2009_3.3-8 (0) | 2009.03.03 |
| 제2회 기술미학포럼_디지털 푼크툼의 순간, 그리고 진정성 (0) | 2009.02.23 |
| 앨리스초이스4회 (0) | 2009.02.23 |
| Virtu(s), LAURENCE DERVAUX 개인전 - 아뜰리에에르메스 _ live! (123) | 2009.02.18 |
| 앨리스팟5회 (0) | 2009.02.16 |
| 백남준의 선물 1 & 비디오 아트 네트워크 포럼 2009 (0) | 2009.02.12 |